Artificial Intelligence

“The rise of powerful AI will be either the best, or the worst thing, ever to happen to humanity.” — Stephen Hawking
Intelligent Machines. Something we've seen and used on a daily basis, but we don't realize how futuristic it is (sci-fi movie type). Of course, we don't have robots doing daily tasks like in I, Robot, nor Will Smith saving the world (yet), but the technology we have today is really impressive.
Talking to Alexa, asking her to play your favorite song, seems pretty ordinary today, but a few years ago it was impossible. Speaking of which, Alexa is practically a personification of what artificial intelligence is. Alexa can perform cognitive functions as humans do, such as perceiving, learning, reasoning and solving problems. Or have you never told a joke to her? Or asked the reason of life?
That's the goal of all artificial intelligence, to streamline human effort, and to assist us make better decisions, and improve the way we deal with problems. It can help you complete a very boring and repetitive task, at the same time it can help scientists to deal with complex data which is either impossible to be handled by a human being or it would take a tremendous amount of time to complete.
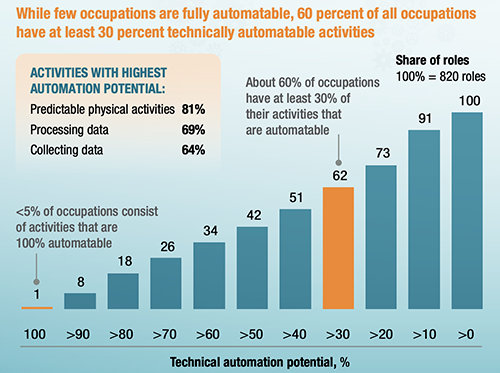
Artificial intelligence is present in almost all industries and areas today. From mobility to healthcare, through education and retail the application of AI has increased immensely. According to McKinsey, AI can automate predictable tasks, and collect/process data. In the United States, these activities make up 51% of activities in the economy, accounting for almost $2.7 trillion in wages.

Automation Potential according to McKinsey Global institute (https://www.mckinsey.com)
As processes are transformed by the automation of individual activities, people will
perform activities that complement the work that machines do, and vice versa.
If we are living the future now, what do we still have for the future? Maybe we're closer to I, Robot and Ex Machina than we thought.
Computer Vision
Object Detection and Classification
Computer vision works in three basic steps: acquiring an image, processing and understanding it. Images, even large sets, can be learned in real-time through video, photos or 3D technology for analysis. Then, deep learning models automate, but the models are often trained by first being fed thousands of labeled or pre-identified images. The final step is the interpretative, where an object is identified or classified.
Face Detection
The goal is to find faces in photos, recognize it nearly instantaneously and finally, to take whatever further action is required, such as allowing access for an approved user. It begins by learning a range of very simple or weak features in each face, that together provide a robust classifier. Then, the models are organized into a hierarchy of increasing complexity.
Face Recognition
In order to perform it, there are two main approaches to face recognition: feature-based methods that use hand-crafted filters to search for and detect faces, and image-based methods that learn holistically how to extract faces from the entire image.
Movement Detection
It follows a few steps to be done: first; the video is segmented into frames, two images (A & B) that were taken back-to-back and converting into gray scale. The following steps would be computing a difference between these two gray scale images and if significant difference is detected between these A & B, it can conclude that some movement has occurred.
Convolutional Neural Network (CNN)
One of the main components of computer vision applications, CNN is great for capturing patterns in multidimensional spaces. Every convolutional neural network is composed of one or several convolutional layers, which it is composed of several filters. Each filter has different values and extracts different features from the input image. Moving deeper into the network, the layers will detect complicated objects such as cars, trees, and people.
Deep Learning
Deep Learning is a subset of machine learning that's based on artificial neural networks. The learning process is deep because the structure of artificial neural networks consists of multiple input, output, and hidden layers. Each layer contains units that transform the input data into information that the next layer can use for a certain predictive task. Thanks to this structure, a machine can learn through its own data processing.
Kernel
Based on the fundamental concept of defining similarities between objects, Kernel methods allows the prediction of properties of new objects based on the properties of known ones or the identification of common subspaces or subgroups in otherwise unstructured data collections, for example.
Pooling
Most convolutional neural networks use pooling layers to keep the most prominent parts and gradually reduce the size of the data. Besides, pooling layers enable CNNs to generalize their capabilities and be less sensitive to the displacement of objects across images.
Padding
Padding works by extending the area of which a convolutional neural network processes an image. Adding it to an image processed by a CNN allows for a more accurate analysis of images.
Natural Language Processing
Speech Recognition
Apple's Siri, Amazon's Alexa and chatbots are examples of real-world applications. They use speech recognition or typed text entries to recognize patterns in voice commands and natural language generation to respond with appropriate action or helpful comments.
Sentiment Analysis
In business, it uncovers hidden data insights from social media channels. Sentiment analysis identifies emotions in text and classifies opinions as positive, negative, or neutral about products, promotions, and events–information. For example, you could analyze tweets mentioning your brand in real-time and detect comments from angry customers right away.
Language Detection
It will be able to predict the given language which is a solution for many AI applications and computational linguists. They are widely used in electronic devices such as mobiles, laptops, and also on robots. Besides, language detection helps in tracking and identifying multilingual documents too.
Transcription (Speech-to-text)
The objective of this system is to extract, characterize and recognize the information about speech. Also known as STT, it gets the “audio data” and then tries to identify patterns and then come up with a conclusion that is text. One of the silver linings would be accuracy rates of greater than 96% and typical search queries with latency of just 50 milliseconds.
Translation
When you translate a sentence in Google Translate, you are using NLP. Language translation is more complex than a simple word-to-word replacement method. It requires grammar and context to fully understand one sentence. And NLP addresses it by processing the text in the input string and maps it with language to translate it on the fly.
Voice Synthesizing (Text-to-Speech)
Text To Speech (TTS) system aims to convert natural language into speech. The field has come a long way over the past few years. Google Assistant and Microsoft’s Cortana are smart devices that exemplifies TTS. Another one is the automatization of audio content in news media.
Text Classification
Another example would be text classification, which helps organize unstructured text into categories and automate the process of tagging incoming support tickets and automatically route them to the right person. For companies, it’s a great way to gain insights from customer feedback.
Ambiguity
By definition, ambiguity is essentially referring to sentences that have multiple alternative interpretations. In AI systems, there are different forms relevant to NLP such as Lexical, Syntactic and Semantic. Metonymy and metaphor are other examples. The process of handling ambiguity is called disambiguation.
Synonymity
It can be solved as a two-step problem: candidate generation and synonym detection. In the first one, given a word, there will generate all possible candidates that might be synonyms for the word. The second step can be solved as a classical supervised learning problem.
Tokenization
A common task in NLP, it is the process of breaking down a piece of text into small units called tokens. A token may be a word, part of a word, or just characters like punctuation. Hence, tokenization can be broadly classified into 3 types – word, character, and subword (n-gram characters) tokenization.
Bag of words
A bag-of-words, or BoW for short, is the simplest form of text representation in numbers. It has that name because any information about the order or the structure of words in the document is discarded. The model is only concerned with whether known words occur in the document, not where they occur in the document.
Embedding
Machine Learning approaches towards NLP require words to be expressed in vector form, often tens or hundreds of dimensions. This is in contrast to the thousands or millions of dimensions required for sparse word representations. In many cases, vector representation of complex entities beyond words is required for certain tasks such as vectors for Sentence, Paragraph and Documents.
Machine Learning

Machine Learning (ML) is a subject area that builds algorithms based on data to improve and/or automatize the decision making process. It's seen as part of Artificial Intelligence (AI), but ML applications are used in many situations that can not be seen as AI but as more simple prediction tasks.
However, currently ML is indeed very related to AI, and it gives devices the ability to improve from experience without being explicitly programmed (called Reinforcement Learning).
For example, you are driving, and using a navigation app to find the fastest route. Or when you use a software or app to convert your voice into a text file. Machine Learning is present and part of our daily lives.
In fact Machine Learning is all about prediction. The "Machine" is only able to predict results based on incoming data. Let's use the example above. The navigation app is able to provide the best route, because it's collecting data from other users that also use navigation/maps apps. The data (average speed, route chosen, location) combined with algorithms makes prediction possible.
Machine Learning along with computer vision has improved many fields, be it helping with disease diagnosis, or analyzing thousands of financial transactions per second in search of fraud. Overall, Machine Learning can be useful in a very specific field of research, or in tasks that are impossible for humans to perform, given their volume or complexity.
It can be used with several approaches:
Supervised learning
It's the execution of ML models where both input and output are knowed and used for prediction and comparision purposes. The Datascientist prepares and configures the model in a dynamic and iterative process until obtain the best and accurate prediction, considering the expected output.
This approach is very useful for prediction (Regressions and classifications)
Unsupervised learning
In this case the output is unknown, so, the model is trained with no expected value to compare, but instead it tries to get insights and correlations between the data.
It is useful in cases where the human expert doesn’t know what to look for in the data so, it is used in pattern detection and descriptive modeling, but in the typical ML process it is used for clustering and feature reduction.
Semi-supervised learning**
It exploits the idea that even though the group memberships of the unlabeled data are unknown, this data carries important information about the group parameters.
Classification
It is utilized when it needs a limited set of outcomes and generally provides predicted output values. It performs as Binomial with and 2 categories output (Like True or False) or as Multi-Class where can predict several categories (Like car types).
One example would be finding whether a received email is spam or not.
Regression
This task can help us predict the value of the label from a set of related features. For example, it can predict house prices based on house attributes such as number of bedrooms, location, or size.
Clustering
Clusters can organize a bunch of data based on their characteristics. This unsupervised learning technique doesn’t have any output information for the training process. Understanding segments of hotel guests based on habits and characteristics of hotel choices is an example.
Neuronal networks
Artificial neural network learning algorithm, or neural network, or just neural. Many synonyms, but one meaning: it uses a network of functions to understand and translate a data input of one form into a desired output, usually in another form.
In general, it does not need to be programmed with specific rules that define what to expect from the input. Instead, the algorithm learns with experience. The more examples and variety of inputs available, more accurate the results typically become.
Due to its characteristic, there is no limit to the areas that this technique can be applied in. A few of them are self-driving vehicle trajectory prediction, cancer research, object detection, etc.
Decision Trees
A decision tree can be used to visually and explicitly represent decisions and decision-making, or creates a model that predicts the value of a target variable. As the name goes, it uses a tree-like model of decisions, in which the leaf node corresponds to a class label and attributes are represented on the internal node of the tree. Belonging to the supervised learning family, this algorithm is generally referred to as CART or Classification and Regression Trees. Simple to understand, interpret, visualize are just a few advantages; they can also implicitly perform variable screening or feature selection and handle both numerical and categorical data. On the other hand, decision-tree learners can create over-complex trees that do not generalize the data well. Besides, it can be unstable because small variations in the data might result in a completely different tree being generated, which it is called variance.
Introduction
Even though it leaves more time to test, tune, and optimize models to create greater value, good data preparation takes more time than any other part of the process. The step before data preparation involves defining the problem. Once it is decided, there are six critical steps to follow: Data collection, Exploration and Profiling, Formatting, Improving data quality, Feature engineering and Splitting data into training and evaluation sets. This includes ensuring that data is formatted in a way that best fits the Machine Learning model; to define a strategy for dealing with erroneous data, missing values and outliers; transforming input data into new features that better represent the business or reduce complexity; and finally splitting the data input in 3 datasets: one for training the algorithm, and another for evaluation purposes and the third one for testing purposes.
Normalization
Standardization
Hyperparameters
Tuning consists in maximizing a model’s performance without overfitting or creating too high of a variance by selecting appropriate “hyperparameters”. They must be set manually, unlike other model parameters that can learn through training methods. Many type of hyperparameters are available and some depend on the technique used. For now we will just retain the concept that and hyperparameter is a configuration value that control the training and evaluation process.
Note: Later we will update our Library with several hyperparameters and techniques.
Cross-validation
Easy to understand, easy to implement. A technique to evaluate and test a Machine Learning model. Cross-validation consists in comparing the model results with the real results to evaluate model accuracy and quality. It is uses in supervised Learning approch for categorizal predictions.
There are many CV models, like K-Fold, Leave-P-Out, but the simplest and most common one is Hold-out.
Note: Later we will update our Library with explanations of these different types.
Mean Square error
Speaking about lacking of precision, mean squared error is able to identify an error soon enough. Being a specific type of loss function, they are calculated by the average, specifically the mean, of errors that have been squared from data.
So, its utility comes from the fact that squared numbers are positive, and that errors are squared before they are averaged. Besides, the mean squared error is often used as a measure to get a better picture of the variance and bias in data sets.
Overfitting
Either way, CV is a very useful for assessing the effectiveness of a model, particularly in cases where it needs to mitigate overfitting. Overfitting is actually a concept in data science, which occurs when a statistical model fits exactly against its training data - there is a low error rate and the test data has a high error rate. One of the ways to avoid it would be through data augmentation. While it is better to inject clean, relevant data, sometimes noisy data is added to make a model more stable. This method should be done sparingly, though.
Data Warehouse
Data Warehouse is a kind of data management system that is used as a main entity for business intelligence systems. This system contains enormous amounts of data and its job is to perform meaningful queries and analysis. For designing we have two approaches named Kimball model and Inmon model, both of which are described as follows:
Kimball:
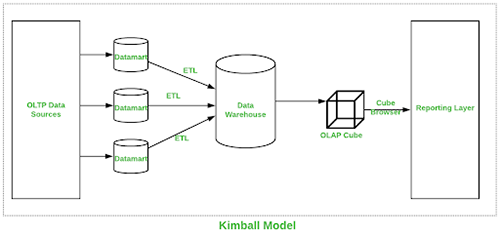
This approach was introduced by Ralph Kimball. Here the process of designing a data warehouse commences by understanding business process and queries the data warehouse system has to answer. For Kimball, the main concern is the performance on query execution and not disk space, so he uses a more denormalization form for modeling data.
The Extract Transform Load (ETL) procedures gathers data from various sources and club them into a common area called staging which is then transformed into OLAP cube (Several types of OLAP can be used).
Benefits of this process are as follows:
- • Quick to setup.
- • Successful reports generation against multiple star schema.
- • Effective operation.
- • Easy to manage and functional in less space.
- • Faster performance.
- • Uniformization.
Pictorial representation of Kimball Dataware house is shown below:

Inmon:
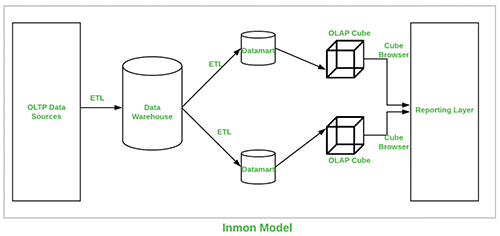
This approach was introduced by Bill Inmon and it commences with a corporate data model which identifies critical areas while keeping priority on the client, product and vendor. This model is successful for designing models utilized for major operations which is subsequently used to develop a physical model. The positive side of this model is that it is normalized and avoids data redundancy but its complex structure makes it difficult to be utilized for business motives for which data marts are created and each section of department is able to use it to their purposes.
Benefits of this process are as follows:
- • Open to changes.
- • Easy to understand.
- • Reduces disk Space.
- • Reports can be handled across enterprise.
- • ETL process less susceptible to errors.
Pictorial representation of Inmon Data warehouse is shown below:

Star schema:
In terms of data warehouse, under this concept we have a central fact table and various associated tables to that fact table. Such an arrangement resembles a star and this is how it derives its terminology. This is the simplest form of data warehouse schema and its best fit for querying enormous sets of data.
Constellations:
Moving ahead of star schema, where we have two fact tables, instead of one, and these fact tables have various associated tables. Such an arrangement resembles a constellation or a group of stars and that's why it's called constellation schema. Here, the shared dimensions are called conformed dimensions. The concept of conformed dimensions is explained in the next point.
Conformed dimension:
By conformed dimensions we mean those dimensions that are developed in such a manner that they can be used across multiple fact tables in various subject areas of data warehouse. Conformed dimensions yields reporting consistency across subject areas which in turn lowers down development costs of those subject areas by reusing the existing dimensions. The best example of conformed dimension is date dimension as most warehouses only have single date dimension which can be used across the warehouse.
Dimensions:
In the area of data warehouse, the term dimensions signifies a group of reference information about measurable events, which are known as facts. These dimensions classify and explain data warehouse facts and gauze it in a meaningful manner that answers business queries. Dimensions can be called upon as the core of dimensional modelling.
Fact tables:
Fact tables are the central entity in the star schema of a data warehouse. A fact table is used to store quantitative information for various forms of inspection and is often denormalized. A fact table is functional with dimension tables and it guards the data to be examined whereas a dimension table guards data about the methods in which data can be examined and analyzed.
Data management:
A procedure that includes ingesting, saving, assembling and preserving the valuable set of data that is both collected and generated by an organization. Data management plays an important role in installing IT systems that helps an organization in their decision making and strategic planning by managers and end users.
Effective data management is dependent on the following factors.
Data quality:
Here we measure the state of the date on various factors like correctness of the data, its integrity and if it is generated consistently or not. These factors play an important role in deciding the quality of data that can be in turn used for running various applications.
Data profiling:
The second important factor is to review the source from where data is generated, knowing its structure, its content, its relationships with other data sources and understanding how this data can help with our projects. This analysis helps us save time on identifying problems and designing solutions.